Letting atomic simulations learn from phase diagrams
Ten times more efficient than previous methods, a new machine learning method builds a two-way connection between atomic simulation and experimental data.
Ten times more efficient than previous methods, a new machine learning method builds a two-way connection between atomic simulation and experimental data.
A new computational method allows modern atomic models to learn from experimental thermodynamic data, according to a University of Michigan Engineering and Université Paris-Saclay study published in Nature Communications.
Leveraging a machine learning technique called score matching, the method expresses the thermodynamic free energy of atomic systems as a function of the underlying atomic interaction model, unlike standard schemes where the interaction model is fixed.
By returning thermodynamic predictions as functions rather than static numbers, the method, which is also over ten times more efficient than previous approaches, can easily quantify and help accelerate computational materials discovery by opening up new inverse design capabilities. The method is called “descriptor density of states” and is abbreviated D-DOS. The study was funded by the National Science Foundation and the French National Research Agency.
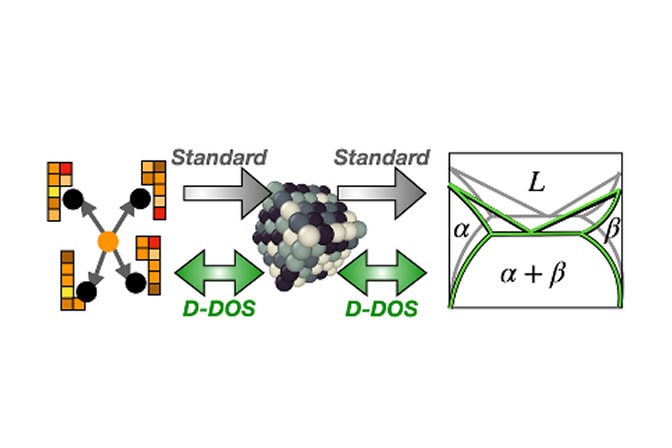
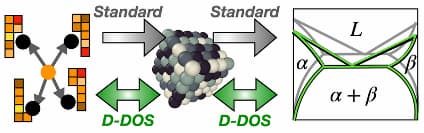
“The D-DOS method provides a two-way connection between the latest generation of atomic simulations and the classical resource of phase diagrams, exposing these datasets to machine learning-driven computer models,” said Thomas Swinburne, an assistant professor of mechanical engineering at U-M and co-corresponding author of the study.
In the search for a metallic alloy for use in a turbine engine or fusion energy component, a materials scientist needs to make sure the material will not warp, crack or melt under extreme heat fluctuations. An essential step in understanding these properties is to calculate the material’s vibrational free energy at specific temperatures, which accounts for the way atoms rattle around within the crystal lattice.
Vibrational free energy strongly influences phase stability, which is the tendency of a material to maintain a specific state of matter—like remaining a solid—without changing its internal structure given the conditions. Within crystalline solids like metals, phase stability also refers to the specific lattice arrangement of atoms, which can shift between different solid forms, changing other material properties. For example, iron can shift between different packing arrangements that change the space available for atoms to vibrate, which impacts properties like heat capacity, thermal expansion and elasticity.
While critical to predict, vibrational free energy is difficult to measure experimentally and computationally expensive to estimate. An atomic simulation called thermodynamic integration served as the previous standard for predicting phase stability. The method requires selecting an atomic interaction model—the mathematical rulebook that defines how atoms push and pull one another—and performing extensive calculations. Because these calculations are tied to that specific rulebook, the entire process must be restarted each time a new temperature or parameter is introduced.
Researchers struggle to reconcile thermodynamic integration with experiments. Due to the highly sensitive nature of phase stability, even state-of-the-art machine-learning models predict phase transition temperatures many hundreds of degrees away from real-world experiments. Until now, researchers had no efficient way to leverage experimental data to course-correct the model to make it match existing experiments and, in the future, make more accurate predictions.
To simplify this process, the research team developed D-DOS, which captures all the possible ways atoms can be arranged in a material via a probability distribution in a high dimensional “latent space”.
The researchers learn the probability distribution using a machine learning technique called score matching. Once the D-DOS is built, researchers can test thousands of different atomic interaction models against it in a few seconds. This “model-agnostic” approach avoids having to start the process over each time a parameter changes.
“Claude Shannon, a University of Michigan alumnus, taught us to measure information with entropy. But Shannon’s entropy also connected information and physics: entropy can be treated as a measurable, predictive quantity. With D-DOS, we bring that idea into atomistic simulation, learning an entropy landscape in the latent space of modern machine learning models. It is a direct bridge from Shannon’s information theory to today’s data-driven statistical mechanics,” said Mihai-Cosmin Marinica, a research engineer at Université Paris-Saclay and co-corresponding author of the study.
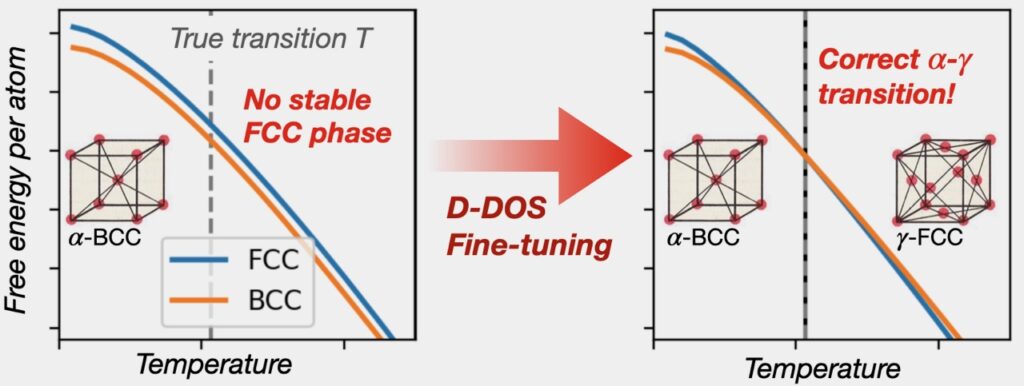
Importantly, because the D-DOS map is a smooth mathematical function, it can work backwards. This allows researchers to use experimental data to fine-tune the model using back-propagation, the same math used to train neural networks, until simulations match real-world experiments.
Beyond fine-tuning, back-propagation allows inverse design. Instead of starting with a material and assessing its properties, researchers can flip the script and start with the desired property, like stability at 2,000 C, and search for the atomic interaction laws that will produce that property.
“By solving a previously inaccessible inverse problem, our method opens new pathways for predictive materials simulations that can leverage existing experimental datasets, giving new strategies to overcome the known limitations of quantum mechanical simulations,” said Swinburne.
This research was funded by the U.S. National Science Foundation (DMS-1925919; DMS-1929348), French National Research Agency (Agence Nationale de la Recherche, ANR-11-IDEX-0003-01) and GENCI (Grand équipement national de calcul intensif, A0170906973).