Web app, dashboard from U-M to inform Michiganders’ return to work
The web tools will help state officials identify potential hotspots as they reopen Michigan to business.

The web tools will help state officials identify potential hotspots as they reopen Michigan to business.
University of Michigan faculty, staff, alumni and students have developed online tools designed to help local and state officials reopen the economy safely and gradually while allowing them to quickly identify and respond to potential coronavirus hot spots and outbreaks.
The tools include a COVID-19 symptom checklist web application and COVID-19 dashboard that provides real time, visualized data for officials to easily identify areas where coronavirus presents a higher risk and for the public to understand the pandemic status in their community and across the state.
“We need to find safe ways to re-engage with our communities so that we can mitigate the spread of disease and risk while still allowing us to resume some level of economic activity. In order to do that, we need real time information on the movement of the epidemic throughout the community so local and state officials can make informed decisions on how and where to re-engage,” said Emily Martin, a professor at the U-M School of Public Health. “Unfortunately, this is an epidemic that could be with us for a very long time.”
Since the pandemic broke out, a team of experts from U-M’s School of Public Health have been working closely with the state’s departments of Health and Human Services and of Labor and Economic Opportunity, providing expertise in modeling and forecasting data, identifying different stages of the pandemic to inform state’s closures and working closely with industry leaders to evaluate risk factors for different working settings and coming up with risk mitigating strategies to reopen those workplaces.
After identifying the need for up-to-date health related information throughout the state’s population, the team invited participation from colleagues from Michigan Engineering and U-M’s School of Information who have the expertise in developing apps, data management, user experience and data protection to develop the tools.
“We’re using a precision population health approach, using data, key public health indicators and technology to help the state manage this pandemic and re-engage the economy safely,” said project lead Sharon Kardia, professor of epidemiology and associate dean for education at U-M’s School of Public Health. “My hope for the people of the State of Michigan is that we can go back to work safely, that we can actually enjoy some of the beautiful summer that’s coming and that we can do this while paying attention to the ways in which we may be at risk so that we can actually counter that risk.”
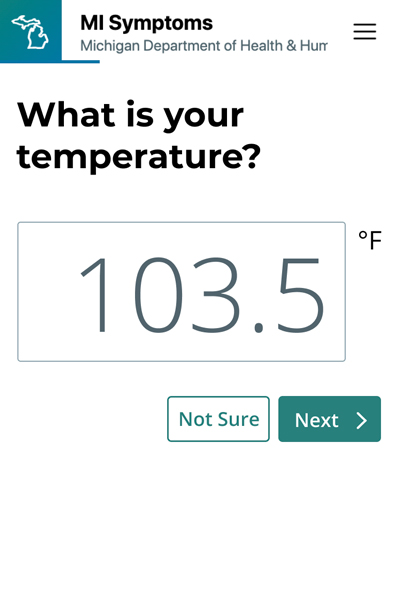
The web app, called MI Symptoms, is designed to be used on a daily basis as Michiganders head back to work. Some employers may ask or require employees to use it to help identify potential cases of COVID-19 before it can spread.

It includes questions such as: How are you feeling? Is anyone in your household sick? Have you been around anyone who tested positive for COVID-19? Users also enter their body temperature and review a list of COVID-19 symptoms, checking off any they’re experiencing.
While other wellness apps and websites can monitor COVID-19 symptoms, the U-M developers say theirs is unique in that it was built with a focus on security and it has a singular goal.
“This is purpose-built to support the state of Michigan’s re-opening in a safe, measured way,” said Dan Maletta, executive director of information technology at Michigan Engineering who co-led the web app’s development.
“There are a number of other apps that exist to collect this information. In many cases they are developed by private companies and they may not share data with the state and university and could even use some of the data for their own purposes.”
While the web app will be accessible through mobile devices, it is not a mobile app. It will not be used for contact tracing, and it will not track users’ locations or movements through GPS or Bluetooth. Even if users choose to sign in through Facebook or Google, it will not share any information with those companies.
Security was paramount throughout development, Maletta said.
“We have taken measures to isolate the information coming through the app and separate it from any personally identifiable user data,” Malleta said. “We will also only store the most anonymized version of data.”
The MI Safe Start Map dashboard development was led by the U-M School of Information in partnership with the School of Public Health, involving dozens of faculty, staff, students and alumni.
The goal is to help state leaders “balance lives and livelihoods” as they determine when it is safe to resume various activities as the state emerges from the current stay-at-home directives, said Paul Resnick, Michael D. Cohen Collegiate Professor of Information and associate dean for research.
“Given there are many indicators that could show something is going wrong, you want a way to systematically monitor them, calling people’s attention and having them then go and investigate something before making the difficult decisions about when to reopen what,” Resnick said.
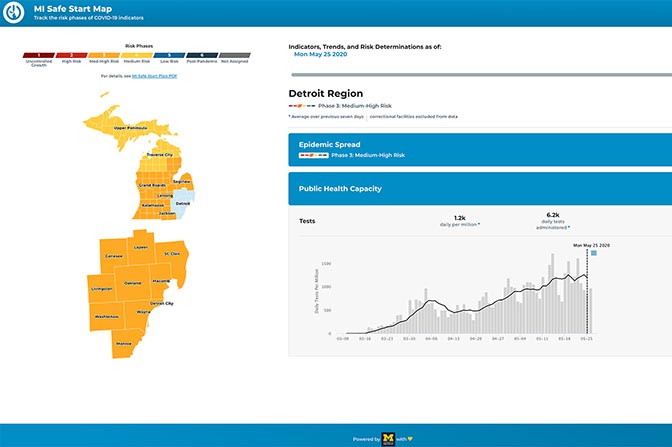
Using procedures developed by epidemiologists Emily Martin, Marisa Eisenberg and Jon Zelner at the School of Public Health, the dashboard uses key public health indicators such as number of daily new cases per million residents and percent positive tests to help local and state public health officials identify and track hotspots that require further attention. A scaled down version for the general public lets people look up the current risk phase of their region and see some of the underlying indicators that contributed to officials’ determinations.
The MI Safe Start Map for health officials includes both levels and trends in indicators such as numbers of new cases, deaths, and positive tests that reflect the most up-to-date data distributed to the School of Public Health from the MDHHS. Another indicator comes from MI Symptoms. It also tracks health system capacity and public health capacity, such as availability of tests and trained contract-tracing personnel.
The public-facing dashboard uses a color-coded map of the state with breakdowns by region and county. Each area is labeled with the current status of the virus to show where the coronavirus is most active and where it is more under control, based on the data.

In all, more than 80 staff, faculty members and students from engineering, UMSI and School of Public Health contributed to the app and dashboard development. The groups worked nearly around the clock in various teams, seven days a week since joining the project April 20.
“These students put their heart and soul into the code,” said Elliot Soloway, professor of computer science and engineering and professor of education. “A lot of them have an emotional connection to the COVID crisis. People they know are sick people or have passed away so they want to do this and they want to do a good job and they want to do it now.”
In addition to Soloway, Computer Science and Engineering faculty members Sugih Jamin, an associate professor, and Jeff Ringenberg, a lecturer IV, also advised the students.
Ani Madurkar just completed his first year in the Master of Applied Data Science program at UMSI, during which he chose to work on how demographics like wealth and population impact COVID. This caught the attention of UMSI faculty who nominated students for the team.
His girlfriend works as a pharmacy resident on the front lines at Cleveland Clinic, which he said inspires him to use his skills to “serve a larger purpose.”
“I feel a huge sense of responsibility for it. Data scientists should be cognizant of the impact they have in society,” said Madurkar, an IT data analyst in Okemos, Michigan.
“I think that there is a sense of validation that will be there,” he said of the prospect the state would use the tool. “It’s exciting to see what this could mean for the future of health and technology.”
Kardia said the sense of responsibility and urgency was very real for the whole team.
“This pandemic has many of us very scared that if we don’t act now and we don’t act with the best science behind us, then we’ll end up with an unintentional disaster on our hands,” Kardia said. “There’s a great sense of urgency and my colleagues and I have put all of our best time and attention, best mind, heart and body toward this effort.”
Written by Nardy Baeza Bickel, Laurel Thomas and Nicole Casal Moore
mlive.com
may 29, 2020
MI Symptoms web app built by University of Michigan is detailed in MLive.