Satellites reveal tropical wetland flooding did not cause methane surge
Human activity or other wetland factors like temperature or soil chemistry could be at play.
Human activity or other wetland factors like temperature or soil chemistry could be at play.
Experts
A large increase of atmospheric methane between 2020 and 2022 raised concerns that tropical wetland emissions had surged in response to a changing climate, but a study led by the University of Michigan shows that’s not the case. The methane must have come from somewhere else.
Warmer and wetter tropics could lead to amplified wetland methane production from decomposing biomatter. More methane in the atmosphere leads to higher temperatures, and possibly more rain, fueling further decomposition and methane production—potentially creating a vicious cycle of a climate-methane feedback loop.
Satellite data revealed that changes in tropical wetland inundation—areas of tropical land covered in fresh water—did not cause the rise of atmospheric methane, according to the study in Nature Communications Earth & Environment.
“Our work challenges the established view that the recent methane surge was primarily caused by tropical wetland emissions,” said Ying Xiong, a research fellow of climate and space sciences engineering at U-M and lead author of the study.
“We demonstrated that dominant hydrological drivers including inundation, precipitation, and terrestrial water storage, did not power the 2020-2022 methane surge,” added Xiong.
Methane—the second-most abundant greenhouse gas behind carbon dioxide—has contributed about a third of the 1.2°C of warming since preindustrial times. While more effective at trapping heat than carbon dioxide, methane breaks down faster. It chemically reacts in the atmosphere to form water vapor and carbon dioxide in about ten years, while carbon dioxide lingers for centuries.
Atmospheric methane levels steadily rose between 2007 and 2019 with annual growth rates of about 7.3 parts per billion (ppb). Growth rates then doubled to 14.8 ppb in 2020, then reached the highest recorded at 17.7 ppb in 2021 before a slight decrease to 13.1 ppb in 2022.
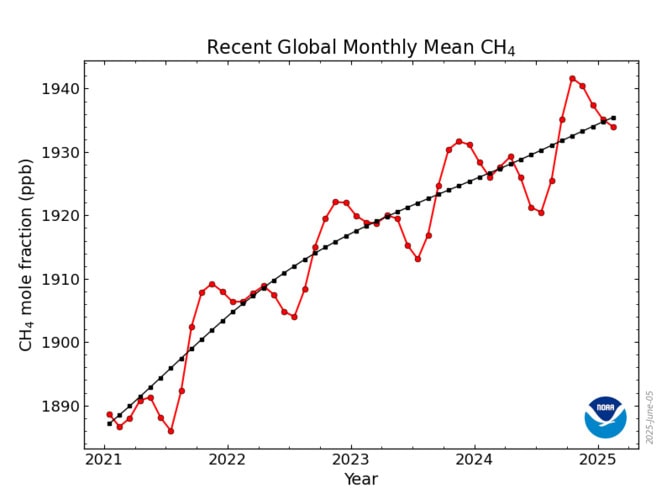
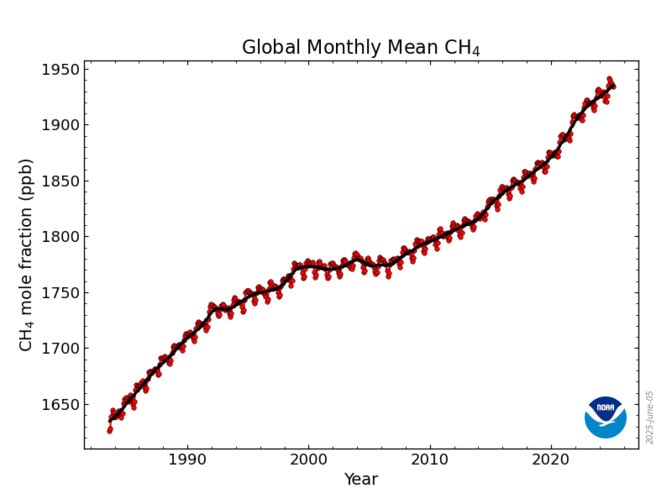
The graphs show globally-averaged, monthly mean atmospheric methane abundance determined from marine surface sites. The first graph shows monthly means for the last four years plus the current year, and the second graph shows the full NOAA time-series starting in 1983. Values for 2025 are preliminary, pending recalibrations of standard gases and other quality control steps. Source: NOAA Global Monitoring Laboratory.
The potent greenhouse gas comes from both natural sources—primarily wetlands—and human activities, including fossil fuels, agriculture and landfills.
Wetlands are estimated to contribute about 30-40% of global methane emissions, with tropical wetlands accounting for the majority. However, tropical wetland methane emissions are difficult to measure both by land and satellite—hindered by dense swamps, clouds, and vegetation canopy cover.
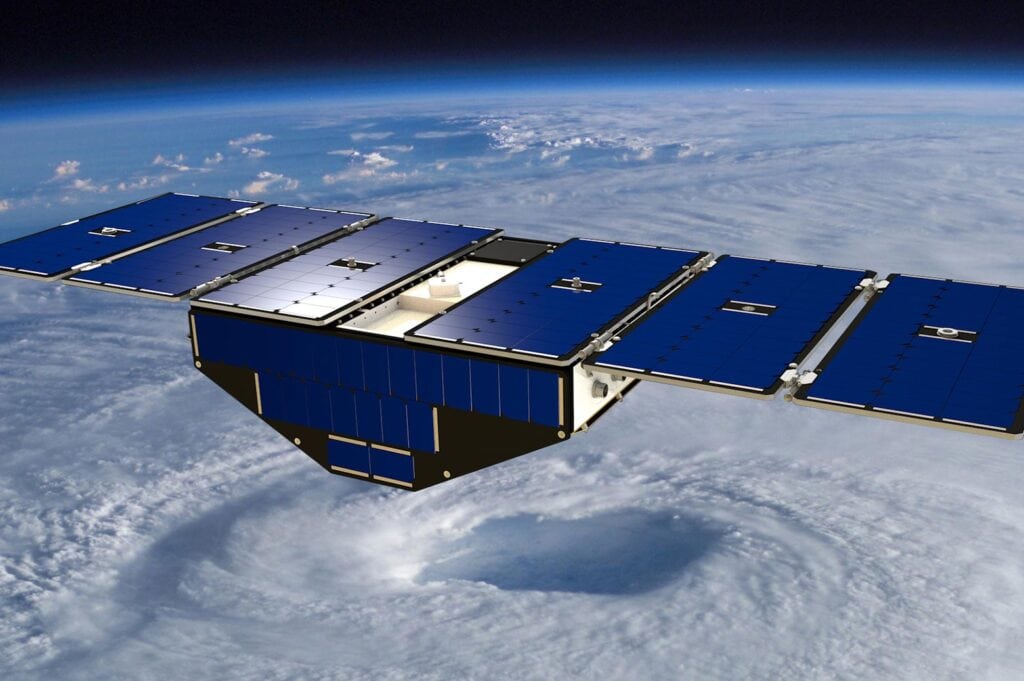
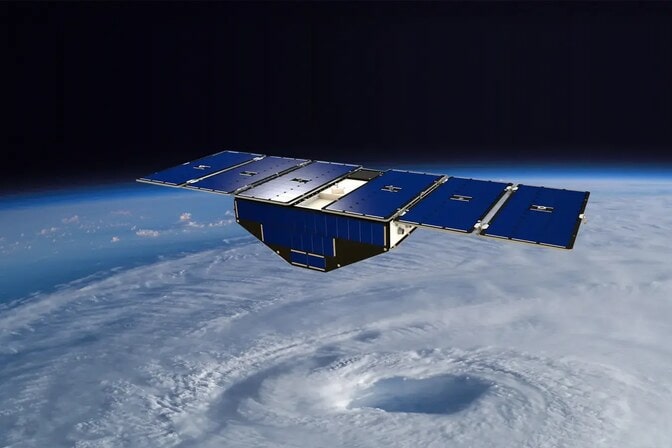
To overcome these obstacles, the research team leveraged a satellite constellation—called the Cyclone Global Navigation Satellite System or CYGNSS—originally developed by U-M for NASA to study hurricanes. Instead of measuring methane directly, CYGNSS measures how GPS signals from other satellites reflect, which is different depending on whether signals are bouncing back from dry land or water.
“Our work with CYGNSS shows how measurements of Earth from space can provide critical insights, sometimes beyond designed mission capabilities, to advance our understanding of how the Earth system is behaving,” said Eric Kort, a professor of climate and space sciences and engineering at U-M and corresponding author of the study.
Using the satellite data and topographic information, the team generated a map of tropical inundation with fine-grained spatial detail at daily and monthly intervals. When analyzed alongside the methane spike, results demonstrate tropical wetland inundation or rain were unlikely to be primary drivers of the 2020–2022 methane surge.
“This finding suggests we should shift focus to find what other methane controls could be responsible for the surge, like agricultural or waste emissions or non-hydrological controls in tropical wetlands like temperature or soil organic carbon availability,” said Xiong.
NASA’s Jet Propulsion Laboratory at the California Institute of Technology and University of California, Berkeley also contributed to this research.
This work was supported by the National Aeronautics and Space Administration (Grant 80NSSC21K1005).