
East Coast cities emitting twice as much methane as EPA estimated
The first study to examine natural gas losses across many cities suggests leaky pipes and inefficient appliances are major culprits. – By Theo Stein, NOAA
The first study to examine natural gas losses across many cities suggests leaky pipes and inefficient appliances are major culprits. – By Theo Stein, NOAA
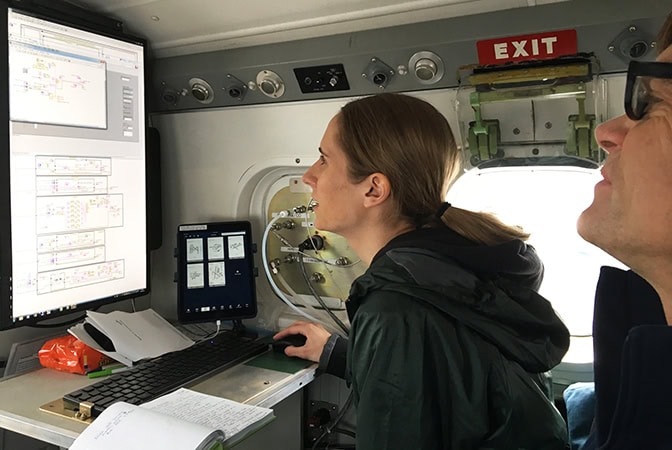
Using an instrumented airplane, a team of researchers led by the University of Michigan has found unexpectedly large emissions over five major cities along the East Coast – twice the EPA’s estimate for methane and almost 10 times the estimate for natural gas.
The airborne measurements covered Washington, D.C., Baltimore, Philadelphia, New York, Providence and Boston during 20 research flights that took place over a month in spring 2018. NOAA Twin Otter aircraft measured levels of methane, carbon dioxide, carbon monoxide, and ethane upwind and downwind of urban areas.
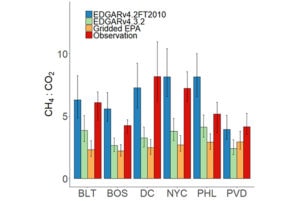
“We found that methane emissions in the five largest cities that we sampled are significant – about double what the EPA estimates for the total emissions,” said Genevieve Plant, a postdoctoral researcher in the Department of Climate and Space Sciences and Engineering at the University of Michigan and lead author of a paper on the findings published in Geophysical Research Letters.
“The amount of natural gas that flows into these older cities is very large. That means leakage from old cast-iron pipes and “end-use” losses from inefficient appliances could be potentially be significant.”
Methane is a primary component of natural gas. Atmospheric methane is a powerful greenhouse gas that also contributes to ground-level ozone pollution. In the past decade, there has been intense scientific focus on improving the accuracy of methane emissions estimates in the United States, with most of the effort targeting oil- and natural gas-producing basins rather than urban areas.
Quantifying methane emissions is important for assessing its current and future impact on climate and air quality. Generally, there are two main sources of methane emissions from cities: methane created by the decay of organic material in landfills, and methane in releases of natural gas from old or leaky pipes or incomplete combustion from older appliances, etc. Ethane is a component of natural gas, but is not generated by landfill, and utilities have precise measurements of how much ethane is in the gas they deliver. So it’s useful as a tracer for separating emissions coming from fossil fuel from those coming from landfills.
One recent synthesis study that estimated emissions from the production field all the way to the edge of cities found methane emissions were 60% higher than estimated by the EPA, said NOAA scientist Colm Sweeney. But that study, like most others, was not focused on examining the loss during distribution and end-use in homes and businesses.
The new study, by contrast, directly measured downwind plumes of emissions coming from these five cities, which included leaks from pipes and appliances. The methods used allowed scientists to quantify the total amount of methane coming from the city. Scientists analyzed the ratio of ethane to methane to calculate how much methane was due to natural gas leakage.
“There’s a real lack of data on urban emissions, including end-use losses,” Sweeney said. “In our study, we found leaks and end-use losses in just five cities was larger than what EPA estimates for leaks in the entire country. That was kind of stunning. The problem is we still do not know exactly where it is coming from. Is it the pipes? Is it the appliances?
We found leaks and end-use losses in just five cities was larger than what EPA estimates for leaks in the entire country. That was kind of stunning.
Colm Sweeney, NOAA
“What we do know is that this provides a huge opportunity for emissions reduction if we can determine the source of these leaks.”
While there have been a handful of other studies of urban areas scattered around the country, this study sampled one of the largest metropolitan megaplexes, home to about 12% of the US population.
“Our work shows high emissions appear across these major East Coast cities, but more work is needed to extrapolate across the US,” said Eric Kort, assistant professor of climate and space sciences and engineering at U-M.
The study was funded by NOAA, NASA, NIST, and the Environmental Defense Fund. The paper is titled “Large fugitive methane emissions from urban centers along the US East Coast.”